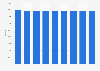
| Characteristic | Share of punctual trains |
|---|---|
| Hiawatha, Milwaukee-Chicago | 95% |
| Capitol Corridor, Auburn-Sacramento-Emeryville- Oakland-San Jose | 91% |
| Keystone, New York-Philadelphia-Harrisburg | 86% |
| Empire Service, New York-Albany-Syracuse- Rochester-Buffalo-Niagara Falls | 84% |
| Ethan Allen Express, Rutland-Albany-New York | 81% |
| Missouri River Runner, St. Louis-Jefferson City- Kansas City | 81% |
| Pennsylvanian, New York-Pittsburgh | 81% |
| Heartland Flyer, Oklahoma City-Fort Worth | 78% |
| Northeast Regional* | 77% |
| San Joaquins, San Francisco Bay Area/ Sacramento - Bakersfield/ Southern California | 77% |
| Acela Express** | 76% |
| Maple Leaf, Toronto-Niagara Falls New York | 75% |
| Hoosier State, Indianapolis-Chicago | 73% |
| Downeaster, Brunswick-Portland-Boston | 72% |
| Vermonter, St.Albans-Burlington-Springfield- New York-Washington, DC | 70% |
The chart is not accessible to screen readers. Please switch to the table view to access the data.
Loading statistic...
Download
Source
More information
Region
North America
Survey time period
October 2016 to September 2017
Supplementary notes
On-time performance is calculated by dividing the number of trains arriving on time at the end-point by the total number of trains operated on the route.
To retrieve the data click on the route name.
* Northeast Regional travels on the following route: Boston-Providence-Hartford-New York-Washington-Lynchburg-Petersburg-Norfolk-Virginia Beach.
** Acela Express travels on the following route: Boston-New Haven-New York-Philadelphia-Baltimore-Washington.
Citation formats