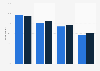
| Characteristic | Share of respondents |
|---|---|
| - | - |
| - | - |
| - | - |
| - | - |
| - | - |
| - | - |
| - | - |
| - | - |
The chart is not accessible to screen readers. Please switch to the table view to access the data.
Download
Source
Source
Release date
April 2016
More information
Region
United Kingdom
Survey time period
2007 to 2015
Number of respondents
1,019 (2015)
Special properties
all with social media profile.
Supplementary notes
* The original survey question was, "How often do you visit any social media sites or apps (like Facebook, Twitter, LinkedIn, Instagram, Tumblr or Pinterest), using any device?"
Citation formats