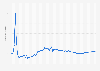
| Characteristic | 2018 | 2019 | 2020 | 2021 |
|---|---|---|---|---|
| - | - | - | - | - |
| - | - | - | - | - |
| - | - | - | - | - |
| - | - | - | - | - |
| - | - | - | - | - |
| - | - | - | - | - |
| - | - | - | - | - |
| - | - | - | - | - |
| - | - | - | - | - |
| - | - | - | - | - |
| - | - | - | - | - |
| - | - | - | - | - |
| - | - | - | - | - |
| - | - | - | - | - |
The chart is not accessible to screen readers. Please switch to the table view to access the data.
November 2021
Germany
2018 to 2021
14 years and older
German-speaking population
Computer-assisted personal interviews (CAPI)
Information on population:
German-speaking population aged 14 years and older
Information on total sample:
2018: 23,086 respondents, representing 70.45 million people
2019: 23,120 respondents, representing auf 70.60 million people
2020: 23,138 respondents, representing auf 70.63 million people
2021: 23,299 respondents, representing auf 70.54 million people
The figures displayed refer to the following studies:
2018: VuMA 2019; 2019: VuMA 2020; 2020: VuMA 2021; 2021: VuMA 2022
Further information on the methodology available and in the .
Figures were rounded for better understanding.
Multiple answers were possible, therefore percentage sums may exceed 100 percent.