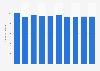
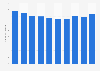
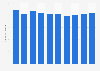
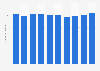
| Characteristic | Emissions in thousand metric tons |
|---|---|
| - | - |
| - | - |
| - | - |
| - | - |
| - | - |
| - | - |
| - | - |
| - | - |
| - | - |
| - | - |
| - | - |
| - | - |
| - | - |
| - | - |
| - | - |
| - | - |
| - | - |
The chart is not accessible to screen readers. Please switch to the table view to access the data.
Download
Source
Sources
Release date
June 2024
More information
Region
United Kingdom
Survey time period
1990 to 2022
Supplementary notes
Figures represent emissions caused by UK residents and businesses whether in the United Kingdom or abroad, but exclude emissions within the United Kingdom which can be attributed to overseas residents and businesses.
Sector and industry classification is based on the NACE code, which is the industry standard classification system for economic activities in the European Community.
Citation formats