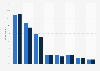
| Characteristic | Number of trips per person per year |
|---|---|
| - | - |
| - | - |
| - | - |
| - | - |
| - | - |
| - | - |
| - | - |
| - | - |
| - | - |
| - | - |
| - | - |
| - | - |
| - | - |
The chart is not accessible to screen readers. Please switch to the table view to access the data.
Download
Source
Source
Release date
July 2019
More information
Region
United Kingdom (England)
Survey time period
2018
Number of respondents
276,000 trips (all purposes)
Special properties
National Travel Survey
Method of interview
Face-to-face interview
Supplementary notes
* Mostly private hire bus (including school buses).
** Air, ferries, light rail.
Citation formats