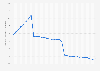
| Characteristic | Number of registered vehicles in thousands |
|---|---|
| - | - |
| - | - |
| - | - |
| - | - |
| - | - |
| - | - |
| - | - |
| - | - |
The chart is not accessible to screen readers. Please switch to the table view to access the data.
Download
Source
More information
Region
Serbia
Survey time period
2005 to 2016
Supplementary notes
Stock at the end of each year shown. Data includes buses, coaches, minibuses and sometimes also trolley buses.
Citation formats