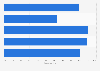
| Characteristic | Distribution of clinics |
|---|---|
| - | - |
| - | - |
| - | - |
| - | - |
The chart is not accessible to screen readers. Please switch to the table view to access the data.
Download
Source
Source
Release date
February 2023
More information
Region
United States
Survey time period
2020
Number of respondents
449 clinics
Supplementary notes
This report includes 326,468 ART cycles performed in 2020 by the 449 clinics that reported their data as required. The 326,468 total cycles performed in 2020 excludes 7 cycles started in which a new treatment procedure was being evaluated.
ART: Assisted Reproductive Technology
Citation formats