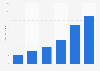
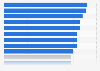
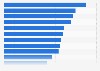
| Characteristic | Medicare payment in million U.S. dollars |
|---|---|
| - | - |
| - | - |
| - | - |
| - | - |
| - | - |
| - | - |
| - | - |
| - | - |
| - | - |
| - | - |
The chart is not accessible to screen readers. Please switch to the table view to access the data.
Download
Source
Source
Release date
March 2016
More information
Region
United States
Survey time period
2014
Supplementary notes
Values are for drugs delivered in the physician office and at home.
* Drugs used for treatment of patients with cancer. Pricing data reflects 4th quarter 2014 payment rates, which correspond to 2nd quarter 2014 manufacturer reports.
Citation formats