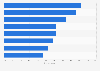
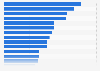
| Characteristic | 2014 | 2017 |
|---|---|---|
| Watch TV | 93% | 94% |
| Cook a meal at home and have dinner as couple/family | 76% | 72% |
| Watch films at home | 49% | 48% |
| Have an alcoholic drink at home | 47% | 45% |
| Watch sport on TV | 47% | 38% |
| Play computer games | 37% | 34% |
| Go to the pub | 34% | 29% |
| Go to a coffee shop | 30% | 29% |
| Go shopping (not food shopping) | 31% | 27% |
The chart is not accessible to screen readers. Please switch to the table view to access the data.
Loading statistic...
Download
Source
Source
Release date
December 2017
More information
Region
United Kingdom
Survey time period
2014 and 2017
Number of respondents
1677*
Method of interview
Online survey
Supplementary notes
* 2017 survey. n(2014)=1,800.
** The original question was worded as follows: "How often do you do each of the following activities?". Results show all done weekly.
Citation formats