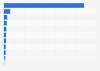
| Age in years | Almost always Welsh | Mainly Welsh | Equal Welsh and English | Mainly English | Almost always English |
|---|---|---|---|---|---|
| - | - | - | - | - | - |
| - | - | - | - | - | - |
| - | - | - | - | - | - |
| - | - | - | - | - | - |
| - | - | - | - | - | - |
The chart is not accessible to screen readers. Please switch to the table view to access the data.
Download
Source
Source
Release date
January 2015
More information
Region
United Kingdom (Wales)
Survey time period
April 2013 to March 2014
Number of respondents
1,770*
Age group
3 years and older
Special properties
Welsh speakers
Method of interview
Postal questionnaire
Supplementary notes
* Percentages not equalling 100 may be due to rounding.
The source identified 3,848 respondents who were Welsh speakers, 46 percent of whom (1,770 respondents) considered themselves fluent and 54 percent of whom (2,078 respondents) considered themselves not fluent.
Citation formats