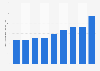


| Characteristic | App companies |
|---|---|
| - | - |
| - | - |
| - | - |
| - | - |
| - | - |
| - | - |
| - | - |
| - | - |
| - | - |
| - | - |
| - | - |
| - | - |
| - | - |
| - | - |
| - | - |
| - | - |
| - | - |
| - | - |
| - | - |
| - | - |
| - | - |
| - | - |
| - | - |
| - | - |
| - | - |
| - | - |
| - | - |
| - | - |
| - | - |
| - | - |
| - | - |
| - | - |
| - | - |
| - | - |
The chart is not accessible to screen readers. Please switch to the table view to access the data.
Download
Source
Source
Release date
June 2014
More information
Region
United Kingdom
Survey time period
H1 2014**
Number of respondents
n (W6) = 7,000+; n (W7) = 10,000+
Special properties
app developers
Method of interview
Online survey
Supplementary notes
* Based on data from Companies House. In order to map the distribution of app companies throughout the UK we used Company House records for software companies created after 2008, when the first app stores emerged. While not all software companies incorporated since 2008 are app companies, we believe that a large number of them are (over 20,000 of the 35,000 software companies in Companies House records were incorporated after 2008). We believe that the distribution of these companies throughout the UK geography is representative of the distribution of app companies in the UK.
** The source indicates that the developer economics surveys (6th and 7th waves) were run within the 9 months previous to June 2014.
*** The App Developer Cencus survey was run in May 2014. There were 330 responses.
Citation formats



