| Characteristic | Number of therapy professionals in thousands |
|---|---|
| - | - |
| - | - |
| - | - |
| - | - |
| - | - |
| - | - |
| - | - |
| - | - |
| - | - |
| - | - |
| - | - |
| - | - |
| - | - |
| - | - |
| - | - |
| - | - |
The chart is not accessible to screen readers. Please switch to the table view to access the data.
May 2026
United Kingdom
2010 to 2025
As of March each year.
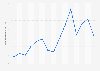
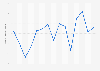
Annual population survey data relating to employees and self-employed health professionals by occupation group (based on Standard Occupation Classification 2010, code 222).
*NOTE: An update in 2021 changed the occupation category. Previously Therapy professionals (222) included only: 2221 Physiotherapists, 2222 Occupational therapists, 2223 Speech and language therapists, 2229 Therapy professionals n.e.c.
Since 2022, Therapy professionals now included: (2221) Physiotherapists, (2222) Occupational therapists, (2223) Speech and language therapists, (2224) Psychotherapists and cognitive behaviour therapists, (2225) Clinical psychologists, (2226) Other psychologists, (2229) Therapy professionals n.e.c.
Therefore comparisons before and after 2022 is not appropriate.
This statistic is using original data from the Office for National Statistics and includes copyright material from 漏 Crown, licensed under the .