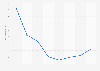
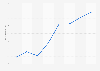
| Characteristic | Established business ownership rate |
|---|---|
| - | - |
| - | - |
| - | - |
| - | - |
| - | - |
| - | - |
| - | - |
| - | - |
| - | - |
| - | - |
| - | - |
| - | - |
| - | - |
| - | - |
| - | - |
| - | - |
| - | - |
| - | - |
| - | - |
| - | - |
| - | - |
The chart is not accessible to screen readers. Please switch to the table view to access the data.
Download
Source
Source
Release date
February 2023
More information
Region
Europe
Survey time period
2022
Number of respondents
about 2,000 per country
Age group
18-64 years
Special properties
data is composed of the Adult Population Survey and the National Expert Survey
Method of interview
Questionnaire
Supplementary notes
Shows the share of the adult population who are owning and managing a business which has paid salaries, wages, or other payments to employees over the past 42 months.
Established businesses and their owner-managers often provide stable employment and exploit the knowledge and social capital accumulated in past experiences. Established businesses are also an important source of new businesses.
Citation formats