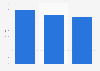
| Age | Share of respondents |
|---|---|
| - | - |
| - | - |
| - | - |
| - | - |
| - | - |
| - | - |
| - | - |
| - | - |
The chart is not accessible to screen readers. Please switch to the table view to access the data.
Download
Source
Source
Release date
April 2016
More information
Region
United Kingdom
Survey time period
Autumn 2015
Number of respondents
1,520**
Age group
16 years and older
Special properties
adults who use a mobile phone
Method of interview
Face-to-face interview
Supplementary notes
* The original survey question was: "Please tell me from this list, the types of things you use your mobile phone for, and how often you do each." (Prompted responses)
** n (16-24) = 235; n (25-34) = 240; n (35-44) = 264; n (45-54) = 250; n (55-64) = 228; n (65-74) = 169; (75+) = 134.
Citation formats