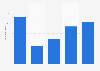
| Characteristic | Spending in million GBP |
|---|---|
| - | - |
| - | - |
| - | - |
| - | - |
| - | - |
| - | - |
| - | - |
| - | - |
| - | - |
The chart is not accessible to screen readers. Please switch to the table view to access the data.
May 2019
United Kingdom (England)
2010 to 2018
100,000***
Face-to-face interview
* All spending figures are in historic prices. Figures from 2010 to 2014 taken from earlier publications.
** The processing of GBTS data was reviewed in 2017 and a new data processing approach implemented from 2016. The 2015 data has been adjusted slightly in order to permit a direct comparison between 2015 and 2016 data. Data prior to 2015 was processed using the old approach.
*** Interviews are carried out every week of the year with a weekly sample size of around 2,000. Around 100,000 respondents are contacted annually in total and any who have returned from an overnight trip in the past four weeks are asked to describe details of that trip. Further information on the GBTS methodology .