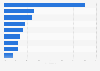
| Characteristic | Share of theatergoers |
|---|---|
| - | - |
| - | - |
| - | - |
| - | - |
| - | - |
| - | - |
| - | - |
| - | - |
| - | - |
| - | - |
| - | - |
| - | - |
| - | - |
The chart is not accessible to screen readers. Please switch to the table view to access the data.
Download
Source
Source
Release date
September 2013
More information
Region
United Kingdom
Survey time period
May 3-23, 2013
Number of respondents
1,006**
Special properties
Attendance to at least one theatre event in the past 3 years
Method of interview
Online survey
Supplementary notes
* Original survey question not provided. Wording may differ.
** The sample was conducted with a sampling agency to create a representative sample of theater attendees in the UK. The survey was complemented with attendees from abroad: 1,006 theatre attendees from the UK, 200 attendees from the US, 100 from Australia, 100 from Ireland and 50 from Germany.
Citation formats