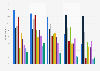
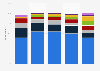
| Characteristic | Very often | Fairly often | Not very often | Not at all |
|---|---|---|---|---|
| - | - | - | - | - |
| - | - | - | - | - |
| - | - | - | - | - |
| - | - | - | - | - |
The chart is not accessible to screen readers. Please switch to the table view to access the data.
Download
Source
Source
Release date
July 2015
More information
Region
United Kingdom
Survey time period
July 22-23, 2015
Number of respondents
1,747**
Age group
18 years and older
Supplementary notes
* This question was only asked to respondents who regularly play computer or video games, or have done in the past; n = 628.
** n (18-24) = 208; n (25-39) = 442; n (40-59) = 597; n (60+) = 500.
Source did not specify type of survey.
Citation formats