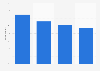
| Characteristic | Share of respondents |
|---|---|
| - | - |
| - | - |
| - | - |
The chart is not accessible to screen readers. Please switch to the table view to access the data.
Download
Source
Source
Release date
November 2013
More information
Region
United States
Survey time period
June 2013
Age group
21-54 years
Special properties
respondents reside in the U.S., go online at least once per month, and have traveled at least once for personal reasons (or a minimum of three times for business) within the past six months; multiple device users who saw speci铿乧 types of ads on smartphones
Method of interview
Online survey
Supplementary notes
Multple answers were possible.
Citation formats