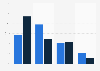
| Characteristic | Should be legal | Should not be legal | No opinion |
|---|---|---|---|
| 2017 May 3-7 | 72% | 23% | 5% |
| 2016 May 4-8 | 68% | 28% | 4% |
| 2015 May 6-10 | 69% | 28% | 4% |
| 2014 May 8-11 | 66% | 30% | 4% |
| 2013 May 2-7 | 64% | 31% | 5% |
| 2012 May 3-6 | 63% | 31% | 6% |
| 2011 May 5-8 | 64% | 32% | 4% |
| 2010 May 3-6 | 58% | 36% | 6% |
| 2009 May 7-10 | 56% | 40% | 4% |
| 2008 May 8-11 | 55% | 40% | 5% |
| 2007 May 10-13 | 59% | 37% | 4% |
The chart is not accessible to screen readers. Please switch to the table view to access the data.
Loading statistic...
Download
Source
Source
Release date
May 2016
More information
Region
United States
Survey time period
2007 to 2017
Number of respondents
1,011*
Age group
18 years and older
Method of interview
Telephone interview
Supplementary notes
*As of 2017. The source does not provide exact numbers of respondents for previous years.
Wording prior to 2009: "Do you think homosexual relations between consenting adults should or should not be legal?"
Citation formats