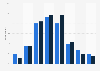
| Characteristic | Male | Female |
|---|---|---|
| - | - | - |
| - | - | - |
| - | - | - |
| - | - | - |
| - | - | - |
| - | - | - |
| - | - | - |
| - | - | - |
| - | - | - |
| - | - | - |
| - | - | - |
| - | - | - |
| - | - | - |
| - | - | - |
| - | - | - |
The chart is not accessible to screen readers. Please switch to the table view to access the data.
Download
Source
Source
Release date
March 2018
More information
Region
United Kingdom (Great Britain)
Survey time period
Q2 2014 to Q1 2018**
Number of respondents
154*
Age group
15 years and older
Special properties
visitors to or users of Google+ in three months previous to survey.
Method of interview
Face-to-face interview
Supplementary notes
* Number of respondents: n (Q2 '14) = 187; n (Q3 '14) = 113; n (Q4 '14) = 137; n (Q1 '15) = 155; n (Q2 '15) = 150; n (Q3 '15) = 153; n (Q4 '15) = 191; n (Q1 '16) = 162; n (Q2 '16) = 179; n (Q3 '16) = 181; n (Q4 '16) = 196; n (Q1 '17) = 151; n (Q2 '17) = 201; n (Q3 '17) = 179; n (Q1 '18) = 154.
** Data for survey waves previous to Q1 2018 published earlier by the source.
*** No data provided by the source for Q4 2017.
Citation formats