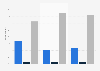
| Expectation | I mostly agree | I totally agree |
|---|---|---|
| Maximal safety | 17.3% | 75.3% |
| Economic mobility | 25.1% | 63.7% |
| Highest comfort when travelling | 34.1% | 51.8% |
| Sustainability and environmental friendliness | 27.6% | 58.1% |
| That it is mainly functional | 37.1% | 41.6% |
| Driving enjoyment - Driving should be fun | 35% | 40% |
| Reflecting my social status/my self-image | 21.2% | 13.7% |
The chart is not accessible to screen readers. Please switch to the table view to access the data.
Loading statistic...
Download
Source
Source
Release date
August 2012
More information
Region
Europe
Survey time period
April 12 to May 17, 2012
Number of respondents
8,844 respondents
Age group
18-65 years
Method of interview
Computer-assisted web interviews (CAWI)
Supplementary notes
The source does not provide detailed information regarding the question. The chosen wording here might therefore differ slightly from the survey.
The source does not provide information regarding the missing percentage points to 100 percent.
The source does not provide information regarding the possibility of multiple answers.
Citation formats