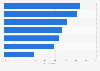
| Characteristic | Share of respondents stating "Yes" |
|---|---|
| District of Columbia | 8.6% |
| Vermont | 5.3% |
| Massachusetts | 4.9% |
| Oregon | 4.9% |
| California | 4.9% |
| Nevada | 4.8% |
| Delaware | 4.7% |
| New Hampshire | 4.6% |
| Washington | 4.6% |
| New York | 4.5% |
| Maine | 4.5% |
| Colorado | 4.3% |
| New Mexico | 4.2% |
| Florida | 4.2% |
| Indiana | 4.1% |
| Minnesota | 4% |
| Rhode Island | 4% |
| Georgia | 4% |
| Arizona | 4% |
| Maryland | 3.9% |
| Illinois | 3.9% |
| Hawaii | 3.8% |
| Michigan | 3.8% |
| Ohio | 3.8% |
| Louisiana | 3.7% |
| New Jersey | 3.6% |
| Nebraska | 3.6% |
| Pennsylvania | 3.6% |
| Texas | 3.6% |
| Wyoming | 3.5% |
| North Carolina | 3.5% |
| Connecticut | 3.5% |
| Oklahoma | 3.5% |
| Virginia | 3.4% |
| West Virginia | 3.4% |
| Missouri | 3.4% |
| Wisconsin | 3.4% |
| Kentucky | 3.3% |
| Utah | 3.3% |
| Mississippi | 3.2% |
| Iowa | 3.2% |
| Tennessee | 3.1% |
| Kansas | 3.1% |
| South Carolina | 3% |
| Alabama | 3% |
| Alaska | 3% |
| Montana | 3% |
| Arkansas | 3% |
| Idaho | 2.8% |
| North Dakota | 2.7% |
| South Dakota | 2% |
The chart is not accessible to screen readers. Please switch to the table view to access the data.
February 2017
United States
January 1, 2015, to December 30, 2016
710,252 respondents
18 years and older
Telephone interview
The original question was: "Do you, personally, identify as lesbian, gay, bisexual, or transgender?"
The source states: "The number of interviews conducted in each state between June and December is large enough to allow for reasonable estimates of each state's LGBT population. Only eight states had less than 1,000 completed interviews, including the lowest sample size of 613 in Alaska. Gallup also asked the LGBT question of 493 District of Columbia residents. The number of completed interviews conducted in each state is presented in the accompanying table [at the source]."