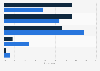
| Characteristic | Share of respondents |
|---|---|
| - | - |
| - | - |
| - | - |
| - | - |
The chart is not accessible to screen readers. Please switch to the table view to access the data.
Download
Source
Source
Release date
January 2013
More information
Region
United States
Survey time period
September 11 to October 4, 2012
Number of respondents
1,217 respondents
Special properties
5th to 12th grade students
Method of interview
Telephone interview
Supplementary notes
The source poses the question as follows:
"In America, each generation has tried to have a better life than their parents, with a better living standard, better homes, a better education, and so on. How likely do you think it is that you will have a better life than your parents - very likely, somewhat likely, somewhat unlikely, or very unlikely?"
The source does not provide accurate information on the age of respondents.
Citation formats