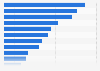
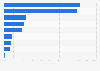
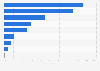
| Characteristic | Much more | Somewhat more | Neither more nor less | Somewhat less | Much less | Not applicable |
|---|---|---|---|---|---|---|
| Television | 24% | 28% | 27% | 11% | 7% | 4% |
| Video games | 24% | 24% | 20% | 5% | 10% | 16% |
| Internet | 22% | 24% | 26% | 5% | 10% | 12% |
| Movies | 21% | 32% | 29% | 8% | 6% | 4% |
| Smartphone usage (i.e. texting, using apps) | 19% | 22% | 24% | 4% | 10% | 22% |
| Social media | 15% | 17% | 26% | 5% | 10% | 27% |
The chart is not accessible to screen readers. Please switch to the table view to access the data.
Loading statistic...
Download
Source
Source
Release date
August 2015
More information
Region
United States
Survey time period
June 17 to 22, 2015
Number of respondents
2,220 respondents
Age group
18 years and older
Special properties
adults who have a child aged 17 or younger at home
Method of interview
Online survey
Supplementary notes
* During the survey, this question was posed as follows: "
鈥淒o your children consume more or less of each of the following types of media during the summer than during other times of the year? By summer, we mean the period of time between Memorial Day and Labor Day."
Percentages may not add to 100% due to rounding.
Citation formats