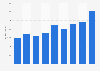
| Country of origin | Share |
|---|---|
| - | - |
| - | - |
| - | - |
| - | - |
| - | - |
| - | - |
| - | - |
| - | - |
| - | - |
The chart is not accessible to screen readers. Please switch to the table view to access the data.
Download
Source
Source
Release date
April 2013
More information
Region
Worldwide
Survey time period
2012
Number of respondents
19,68 Millionen
Supplementary notes
* Other Herbs & Spices include products that represent less than 5 percent of total figures. Figures exclude Vanilla.
Citation formats