Download
Source
Source
Release date
September 2015
More information
Region
United States
Survey time period
2004 to 2015
Number of respondents
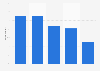
2004: n=401; 2008: n=326; 2012: n=265; 2015: n=228
Age group
13-49 years
Special properties
among TV set users in hour
Method of interview
Online survey
Supplementary notes
Mentions lower than four percent for 2015 not shown.
This question was phrased by the source as follows: "What else did you do while watching that program from 8 to 9 PM ET/PT(7 to 8 PM CT/MT) ?"
Citation formats