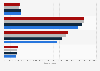
| Characteristic | Share of graduates |
|---|---|
| Professional major, like communications, education, nursing, or social work | 41% |
| A major in the field of math, science, engineering, or technology | 29% |
| Business, like finance or accounting | 17% |
| Social science, like psychology, sociology, economics, or political science | 7% |
| Humanities, like history, art, English, or a foreign language | 4% |
The chart is not accessible to screen readers. Please switch to the table view to access the data.
Loading statistic...
Download
Source
Source
Release date
May 2012
More information
Region
United States
Survey time period
March 21, 2012 to April 2, 2012
Number of respondents
444 respondents
Age group
8-19 years
Special properties
College graduates
Method of interview
Online survey
Supplementary notes
The survey includes college graduates from the class of 2006 through to the class of 2011.
This question was only asked to those who had said that they would have chosen another major in order to be more successful.
Citation formats