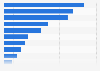
| Characteristic | Percent with a tertiary education |
|---|---|
| Canada | 63.25% |
| Russia* | 56.73% |
| Japan | 55.99% |
| Ireland | 54.54% |
| South Korea | 54.52% |
| United Kingdom | 53.08% |
| Australia | 51.4% |
| Luxembourg | 51.32% |
| United States | 50.71% |
| Israel | 50.34% |
| Sweden | 49.4% |
| Norway | 48.79% |
| Lithuania | 46.37% |
| Switzerland | 46.04% |
| Belgium | 44.81% |
| Iceland | 44.46% |
| Netherlands | 44.25% |
| Saudi Arabia** | 43.79% |
| Denmark | 42.87% |
| Finland | 42.54% |
| France | 42.43% |
| Estonia | 41.59% |
| New Zealand | 41.58% |
| Spain | 41.44% |
| OECD - Average | 40.93% |
| Latvia | 39.18% |
| Poland | 37.94% |
| Austria | 36.62% |
| Greece | 34.33% |
| Slovenia | 33.51% |
| Germany | 33.43% |
| Chile** | 31.44% |
| Hungary | 29.82% |
| Bulgaria**** | 29.78% |
| Portugal | 29.76% |
| Colombia | 28.94% |
| Slovakia | 28.81% |
| Czechia | 26.97% |
| Turkey | 25.92% |
| Costa Rica | 25.31% |
| Argentina*** | 24.77% |
| Italy | 21.58% |
| Brazil**** | 20.97% |
| Mexico | 20.96% |
| Romania**** | 19.67% |
| China (People's Republic of)** | 18.54% |
| South Africa**** | 13.91% |
| Indonesia**** | 13.06% |
| India**** | 12.95% |
The chart is not accessible to screen readers. Please switch to the table view to access the data.
Loading statistic...
Download
Source
Source
Release date
May 2026
More information
Region
Worldwide, OECD
Survey time period
2023
Age group
25-64 years
Supplementary notes
*Numbers from 2018.
**Numbers from 2020.
***Numbers from 2021.
****Numbers from 2022.
Non-OECD members included: Argentina, Brazil, Bulgaria, China, India, Indonesia, Romania, Russia, Saudi Arabia, and South Africa.
Release date represents the date figures were accessed
Citation formats