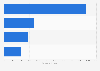
| Characteristic | Share of students |
|---|---|
| - | - |
| - | - |
| - | - |
| - | - |
| - | - |
| - | - |
| - | - |
| - | - |
| - | - |
| - | - |
| - | - |
| - | - |
| - | - |
| - | - |
| - | - |
| - | - |
| - | - |
| - | - |
| - | - |
| - | - |
| - | - |
| - | - |
| - | - |
| - | - |
| - | - |
| - | - |
| - | - |
| - | - |
| - | - |
| - | - |
| - | - |
| - | - |
| - | - |
| - | - |
| - | - |
| - | - |
| - | - |
| - | - |
| - | - |
| - | - |
| - | - |
| - | - |
| - | - |
| - | - |
| - | - |
| - | - |
| - | - |
| - | - |
| - | - |
| - | - |
| - | - |
| - | - |
The chart is not accessible to screen readers. Please switch to the table view to access the data.
February 2012
United States
2009
* This indicator represents the proportion of a state鈥檚 fourth grade students in public schools that has met or exceeded the proficiency standard in science. For the fourth grade, the proficient level (scores 167鈥�223) represents solid academic performance and demonstrates competency over challenging subject-matter knowledge.
** Data is not available.
Approximately 156,500 fourth grade students in 9,330 schools participated in the 2009 NAEP mathematics assessment.
NOTES: National average for United States is reported value in National Assessment of Educational Progress (NAEP) reports. NAEP grade 4 science scores for public schools only.