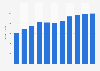
| Characteristic | Local Government | State Government |
|---|---|---|
| 2024 | 67% | 55% |
| 2023 | 70% | 59% |
| 2022 | 67% | 57% |
| 2021 | 66% | 57% |
| 2020 | 71% | 60% |
| 2019 | 71% | 63% |
| 2018 | 72% | 63% |
| 2017 | 70% | 63% |
| 2016 | 71% | 62% |
| 2015 | 70% | 58% |
| 2014 | 72% | 62% |
| 2013* | 71% | - |
| 2012 | 74% | 65% |
| 2011 | 68% | 57% |
| 2010 | 70% | 52% |
| 2009 | 69% | 51% |
| 2008 | 72% | 67% |
| 2007 | 69% | 67% |
| 2005 | 70% | 67% |
| 2004 | 68% | 67% |
| 2003 | 68% | 53% |
| 2001 | 69% | 65% |
| 1998 | 77% | 80% |
| 1997 | 69% | 68% |
The chart is not accessible to screen readers. Please switch to the table view to access the data.
Loading statistic...
Download
Source
Source
Release date
October 2024
More information
Region
United States
Survey time period
2011 to 2024
Number of respondents
1,007 respondents
Age group
18 years and older
Method of interview
Telephone interview
Supplementary notes
During the survey, this question was posed as follows: "How much trust and confidence do you have in the government of the state where you live when it comes to
handling state problems -- a great deal, a fair amount, not very much, or none at all?" and "And how much trust and confidence do you have in the local governments in the area where you live when it comes to handling local problems -- a great deal, a fair amount, not very much, or none at all?"
The statistic above only shows the Top-Two boxes "Great deal" and "Fair amount."
Citation formats