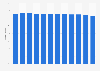
| Metropolitan area | Average monthly rent (in U.S. dollars) | Year-over-year change in rent (in percent) | 1Q apartment vacancy rate (in percent) | Rent payment cheaper than mortgage payment (in U.S. dollars) |
|---|---|---|---|---|
| - | - | - | - | - |
| - | - | - | - | - |
| - | - | - | - | - |
| - | - | - | - | - |
| - | - | - | - | - |
| - | - | - | - | - |
| - | - | - | - | - |
| - | - | - | - | - |
| - | - | - | - | - |
| - | - | - | - | - |
Download
Source
Sources
Release date
August 2011
More information
Region
United States
Survey time period
2011
Supplementary notes
* As of June, 2011. Forbes and Marcus & Millichap rated the 44 biggest cities in the U.S. based on four criteria: Average rent in the first quarter and how much it changed year-over-year; vacancy rates, since more empty units mean more choices and usually better prices; and lastly the cost of renting versus buying. (In the case of New York City, we limited our analysis to Manhattan due to a lack of data for other areas of the city.)
Citation formats