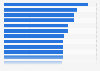
| Characteristic | Number of prisoners in thousands |
|---|---|
| 2023 | 1,254.22 |
| 2022 | 1,230.14 |
| 2021 | 1,205.09 |
| 2020 | 1,221.16 |
| 2019 | 1,430.17 |
| 2018 | 1,464.39 |
| 2017 | 1,489.19 |
| 2016 | 1,508.13 |
| 2015 | 1,526.6 |
| 2014 | 1,562.32 |
| 2013 | 1,576.95 |
| 2012 | 1,570.4 |
| 2011 | 1,598.97 |
| 2010 | 1,613.8 |
| 2009 | 1,615.49 |
| 2008 | 1,608.28 |
| 2007 | 1,596.84 |
| 2006 | 1,568.67 |
| 2005 | 1,525.91 |
| 2004 | 1,497.1 |
| 2003 | 1,468.6 |
| 2002 | 1,440.14 |
| 2001 | 1,404.03 |
| 2000 | 1,394.23 |
| 1990 | 773.92 |
The chart is not accessible to screen readers. Please switch to the table view to access the data.
Loading statistic...
Download
Source
Sources
Release date
September 2025
More information
Region
United States
Survey time period
1990 to 2023
Supplementary notes
U.S. total includes federal prisoners not distributed by state and prison system.
For years ending December 31.
Data includes inmates held in nonsecure privately operated community corrections facilities and juveniles held in contract facilities.
Total estimate for 2018 includes imputed counts for Oklahoma and Oregon, which did not submit 2018 data to National Prisoner Statistics program. Total estimate for 2017 includes imputed counts for New Mexico and North Dakota, which did not submit 2017 data to National Prisoner Statistics program.
Citation formats