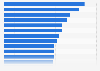
| Year | Percent change |
|---|---|
| - | - |
| - | - |
| - | - |
| - | - |
| - | - |
| - | - |
| - | - |
| - | - |
| - | - |
| - | - |
| - | - |
| - | - |
| - | - |
| - | - |
| - | - |
| - | - |
| - | - |
The chart is not accessible to screen readers. Please switch to the table view to access the data.
Download
Source
Sources
Release date
December 2018
More information
Region
United States
Survey time period
2001 to 2017
Supplementary notes
Average annual percent change. Stock return data are based on the Standard & Poor's 500 index.
Minus sign (-) indicates loss.
Citation formats