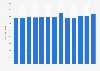
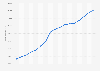
| Characteristic | Percentage of homes |
|---|---|
| - | - |
| - | - |
| - | - |
| - | - |
| - | - |
| - | - |
| - | - |
The chart is not accessible to screen readers. Please switch to the table view to access the data.
Download
Source
More information
Region
Canada
Survey time period
1998 to 2009
Supplementary notes
* All data are as of December 31 of the reference year.
** The figures through 2003 are taken from a previous edition of the publication.
In every second year starting with 2001, statistics for Canada include the territories. For the other years, Canada-level statistics include only the 10 provinces.
Adapted from Statistics Canada, Canada Year Book 2011, page 207, 1998 to 2009. This does not constitute an endorsement by Statistics Canada of this product.
Citation formats