| Characteristic | 2022 | 2023 |
|---|---|---|
| - | - | - |
| - | - | - |
| - | - | - |
| - | - | - |
| - | - | - |
The chart is not accessible to screen readers. Please switch to the table view to access the data.
April 2024
United States
May 2022 to May 2023
as of May each year
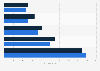
A percentile wage shows the percentage of workers in an occupation that earn less than a given wage and the percentage that earn more. The median wage is the 50th percentile wage estimate - 50 percent of workers earn less than the median and 50 percent of workers earn more than the median.
Cooks in restaurants prepare, season, and cook soups, vegetables, desserts, or other foodstuff in restaurants. May order supplies, keep records and accounts, price items on menu, or plan menu.
The data used is based on the Occupational Employment Statistics (OES) survey which measures occupational employment and wage rates for wage and salary workers in nonfarm establishments, by industry. Employees are all part-time and full-time workers who are paid a wage or salary.