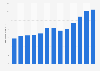
| Characteristic | Gross income in billion U.S. dollars |
|---|---|
| 2024 | 515.03 |
| 2023 | 516.8 |
| 2022 | 516.95 |
| 2021 | 542.61 |
| 2020 | 438.44 |
| 2019 | 363.46 |
| 2018 | 414.2 |
| 2017 | 413.2 |
| 2016 | 412.3 |
| 2015 | 440.8 |
| 2014 | 483.1 |
| 2013 | 483.8 |
| 2012 | 449.8 |
| 2011 | 420.4 |
| 2010 | 356.5 |
| 2009 | 336.6 |
| 2008 | 364.5 |
| 2007 | 339.6 |
| 2006 | 290.2 |
| 2005 | 298.5 |
| 2004 | 294.9 |
| 2003 | 258.7 |
| 2002 | 230.6 |
| 2001 | 249.9 |
| 2000 | 241.7 |
The chart is not accessible to screen readers. Please switch to the table view to access the data.
Loading statistic...
Download
Source
Sources
Release date
February 2026
More information
Region
United States
Survey time period
2000 to 2024
Supplementary notes
* Includes cash receipts from farm marketing, government payments, non-money income (gross rental value of dwelling and value of home consumption), other income (machine hire custom work and recreational income), and value of change in farm inventories. Figures before 2019 were retrieved from previous releases of the USDA annual statistics reports.
The release date is the date of extraction.
Citation formats