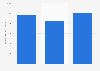
| Vendor | Share of sales |
|---|---|
| - | - |
| - | - |
| - | - |
| - | - |
| - | - |
| - | - |
| - | - |
| - | - |
| - | - |
| - | - |
The chart is not accessible to screen readers. Please switch to the table view to access the data.
Download
Source
More information
Region
United States
Survey time period
June 16, 2007 to June 15, 2008
Supplementary notes
Food, drug, and mass channels (excluding Wal-Mart).
"Sales" refers to the dollar value of sales.
Citation formats