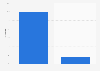
| Characteristic | Average audience in percent of all TV households |
|---|---|
| - | - |
| - | - |
| - | - |
| - | - |
| - | - |
| - | - |
| - | - |
| - | - |
| - | - |
| - | - |
The chart is not accessible to screen readers. Please switch to the table view to access the data.
Download
Source
Source
Release date
June 2012
More information
Region
United States
Survey time period
Jan 1, 2011 - Dec 31, 2011
Special properties
ad-supported subscription television only; programming under 25 minutes excluded
Supplementary notes
* Live+7 estimates. Ranked by average audience in percent. In the event of a tie, impressions (000鈥檚) are used as a tiebreaker.
Citation formats