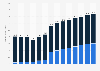
| Characteristic | Share of respondents |
|---|---|
| - | - |
| - | - |
| - | - |
| - | - |
The chart is not accessible to screen readers. Please switch to the table view to access the data.
Download
Source
Sources
Release date
May 2009
More information
Region
United States
Survey time period
March 10-18, 2009
Number of respondents
200 respondents
Age group
21 years and older
Special properties
Interviewees were travel and tourism experts*
Method of interview
Telephone interviews and online survey
Supplementary notes
* Detailed information regarding the question: "How much have casinos and the visitors they attract helped businesses and the overall economic environment in your state?"
All respondents were executive-level officials at convention and visitor bureaus, destination marketing organizations, city and state tourism offices, and state economic development offices among others.
The margin of error for the total sample is +/- 3.5 percent.
Citation formats