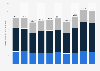
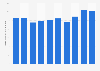
| Characteristic | 2020 | 2021 | 2022 | 2023 |
|---|---|---|---|---|
| - | - | - | - | - |
| - | - | - | - | - |
| - | - | - | - | - |
| - | - | - | - | - |
| - | - | - | - | - |
| - | - | - | - | - |
| - | - | - | - | - |
| - | - | - | - | - |
| - | - | - | - | - |
| - | - | - | - | - |
| - | - | - | - | - |
The chart is not accessible to screen readers. Please switch to the table view to access the data.
Download
Source
More information
Region
United States
Survey time period
2020 to 2023
Supplementary notes
Source notes:
"(1)[Market share] based on U.S. total, includes territories."
"(2) [Direct premiums written] before reinsurance transactions, includes state funds."
* Data for Farmers Insurance Group of Companies and Zurich Financial Group (which owns Farmers' management company) are reported separately by S&P Global Market Intelligence.
**Chubb Ltd. data reflects the 2015 merger with Ace Ltd.
Figures have been rounded.
Citation formats