

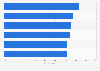


| Characteristic | Index score (100-point scale) |
|---|---|
| - | - |
| - | - |
| - | - |
| - | - |
| - | - |
| - | - |
| - | - |
| - | - |
| - | - |
| - | - |
| - | - |
| - | - |
| - | - |
| - | - |
| - | - |
| - | - |
| - | - |
The chart is not accessible to screen readers. Please switch to the table view to access the data.
Download
Source
Source
In cooperation with
础颁厂滨庐
Release date
July 2018
More information
Region
United States
Survey time period
2002 to 2018
Number of respondents
2018 n = 5,169
Method of interview
Online survey
Supplementary notes
* Data from interviews with approximately 70,000 customers annually are used as inputs into an econometric model to measure satisfaction with more than 200 companies in 44 industries and 10 economic sectors, as well as more than 130 federal government departments, agencies, and websites. Results are released on a monthly basis with all measures reported using a 0-100 scale.
Citation formats



