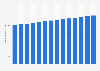
| Characteristic | Residents per square mile of land area |
|---|---|
| 2019 (July 1)* | 92.9 |
| 2010 (April 1) | 87.4 |
| 2000 (April 1) | 79.6 |
| 1990 (April 1) | 70.3 |
| 1980 (April 1) | 64 |
| 1970 (April 1) | 57.5 |
| 1960 (April 1) | 50.6 |
| 1950 (April 1) | 42.6 |
| 1940 (April 1) | 37.2 |
| 1930 (April 1) | 34.7 |
| 1920 (January 1) | 29.9 |
| 1910 (April 15) | 26 |
| 1900 (June 1) | 21.5 |
| 1890 (June 1) | 17.8 |
| 1880 (June 1) | 14.2 |
| 1870 (June 1) | 11.2 |
| 1860 (June 1) | 10.6 |
| 1850 (June 1) | 7.9 |
| 1840 (June 1) | 9.8 |
| 1830 (June 1) | 7.4 |
| 1820 (August 7) | 5.5 |
| 1810 (August 6) | 4.3 |
| 1800 (August 4) | 6.1 |
| 1790 (August 2) | 4.5 |
The chart is not accessible to screen readers. Please switch to the table view to access the data.
December 2019
United States
1790 to 2019
* Data for 2017 are estimates based on the census population estimates, accessible , and using the 2010 census land area.
Area figures represent area on indicated date including in some cases considerable areas not then organized or settled, and not covered by the census. Area data include Alaska beginning in 1870 and Hawaii beginning in 1900. Total area figures for 1790 to 1970 have been recalculated on the basis of the remeasurement of states and counties for the 1980 census, but not on the basis of subsequent censuses. The land and water area figures for past censuses have not been adjusted and are not strictly comparable with the total area data for comparable dates because the land areas were derived from different base data, and these values are known to have changed with the construction of reservoirs, draining of lakes, etc. Density figures are based on land area measurements as reported in earlier censuses.