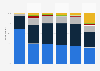
| Characteristic | Very good / good | Neither good nor bad | Very bad / bad |
|---|---|---|---|
| Average | 50% | 31% | 19% |
| Saudi Arabia | 79% | 15% | 6% |
| United Arab Emirates | 77% | 16% | 7% |
| Australia | 69% | 23% | 8% |
| Belgium | 69% | 22% | 9% |
| Switzerland | 68% | 22% | 10% |
| Netherlands | 68% | 23% | 9% |
| Malaysia | 66% | 24% | 10% |
| United States | 66% | 23% | 11% |
| China | 64% | 30% | 6% |
| United Kingdom | 63% | 24% | 13% |
| Sweden | 63% | 25% | 12% |
| India | 60% | 24% | 16% |
| South Korea | 57% | 35% | 8% |
| Indonesia | 57% | 35% | 8% |
| France | 55% | 29% | 16% |
| Argentine | 55% | 32% | 13% |
| Canada | 54% | 30% | 16% |
| Germany | 54% | 31% | 15% |
| Thailand | 53% | 38% | 9% |
| Spain | 50% | 29% | 21% |
| South Africa | 46% | 31% | 23% |
| Ireland | 42% | 30% | 28% |
| Japan | 41% | 50% | 9% |
| Colombia | 38% | 33% | 29% |
| Turkey | 37% | 37% | 26% |
| Chili | 35% | 39% | 26% |
| Italy | 34% | 37% | 29% |
| Mexico | 29% | 40% | 31% |
| Brazil | 29% | 40% | 31% |
| Peru | 21% | 44% | 35% |
| Romania | 21% | 40% | 39% |
| Hungary | 14% | 33% | 53% |
| Poland | 14% | 43% | 43% |
The chart is not accessible to screen readers. Please switch to the table view to access the data.
Loading statistic...
Download
Source
Source
Release date
September 2022
More information
Region
Worldwide
Survey time period
July 22 - August 5, 2022
Number of respondents
23,507 respondents
Age group
18 years and older
Method of interview
Online survey
Supplementary notes
*Definitions of healthcare: "doctors, specialists such as surgeons, hospitals, diagnostic tests, and medications to treat various conditions."
Citation formats