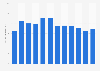
| Characteristic | Non-alcoholic beverage*** | Fruit juice**** |
|---|---|---|
| - | - | - |
| - | - | - |
| - | - | - |
| - | - | - |
| - | - | - |
| - | - | - |
| - | - | - |
| - | - | - |
| - | - | - |
| - | - | - |
| - | - | - |
The chart is not accessible to screen readers. Please switch to the table view to access the data.
Download
Source
Sources
Release date
October 2016
More information
Region
Germany
Survey time period
2005 – 2015
Supplementary notes
The source adds the following information: "* Based on the 2011 Census population data.
** Provisional. Based on the 2011 Census population data.
*** Does not include beverages made from concentrates, syrups, and powdered drinks including teas and postmix sales.
**** Includes fruit nectars and vegetable juices.
Data prior to 2008 are from previous studies in this report.
Citation formats