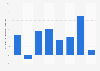
| Characteristic | Share of the profession among female employees |
|---|---|
| Secretaries | 4.7% |
| Qualified administrative employees from other company departments | 2.91% |
| Cleaners | 2.91% |
| Self-service retail employees and store clerks | 2.89% |
| Qualified employees in accounting or financial services | 2.41% |
| Home aides, housekeepers, family workers | 2.41% |
| Nursing Assistants | 1.83% |
| Food saleswomen | 1.73% |
| Hospital service agents | 1.68% |
| Qualified employees in the commercial services of companies (excluding sales) | 1.62% |
| General care nurses, salaried | 1.59% |
| Store cashiers | 1.56% |
| Kitchen assistants, culinary apprentices, and versatile restaurant employees | 1.53% |
| Frameworks of other administrative services of small and medium-sized enterprises | 1.32% |
| Master's degree and technicians in financial or accounting services | 1.32% |
| Saleswomen in clothing and sporting goods | 1.26% |
| Engineers and managers in study, research, and development in computer science | 1.24% |
| Mastery and administrative technicians of other administrative services | 1.2% |
| Serveuses, commises de restaurant | 1.19% |
| Low-skilled administrative employees | 1.1% |
The chart is not accessible to screen readers. Please switch to the table view to access the data.
Loading statistic...
Download
Source
Source
Release date
March 2024
More information
Region
France
Survey time period
2022
Citation formats