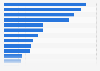
| Occupational group (mean annual wage) | Share of respondents |
|---|---|
| Building and grounds cleaning and maintenance ($38,320) | 23.2% |
| Food preparation and serving ($34,490) | 21.4% |
| Farming, fishing, and forestry ($39,970) | 21.2% |
| Health care support ($38,220) | 18.5% |
| Construction and extraction ($61,500) | 17.3% |
| Transportation and material moving ($46,690) | 15.1% |
| Personal care and service ($38,430) | 14.1% |
| Sales and related ($53,280) | 13.1% |
| Production ($47,620) | 13% |
| Office and administrative support ($47,940) | 12.9% |
| Arts, design, entertainment, sports, and media ($75,520) | 11.7% |
| Installation, maintenance, and repair ($58,500) | 11.4% |
| Community and social services ($58,980) | 8.7% |
| Business and financial operations ($90,580) | 8.3% |
| Health care practitioners and technical ($102,060) | 7.9% |
| Management ($137,750) | 7.1% |
| Education, training, and library ($66,400) | 7.1% |
| Computer and mathematical ($113,140) | 7.1% |
| Protective service ($57,710) | 6.8% |
| Life, physical, and social science ($87,870) | 5.5% |
| Architecture and engineering ($99,090) | 4.2% |
| Legal ($133,820) | 3.8% |
The chart is not accessible to screen readers. Please switch to the table view to access the data.
Loading statistic...
Download
Source
Sources
Release date
May 2025
More information
Region
United States
Survey time period
2022 to 2023
Number of respondents
165,060 respondents
Age group
18 years and older
Special properties
Currently employed or recently unemployed U.S. adults in 36 states and the U.S. Virgin Islands
Method of interview
Telephone interview
Supplementary notes
Respondents who answered 鈥測es鈥� to the question, 鈥淲as there a time in the past 12 months when you needed to see a doctor but could not because you could not afford it?鈥�
Citation formats