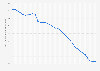
| Characteristic | GII value (lower values represent better performance) |
|---|---|
| - | - |
| - | - |
| - | - |
| - | - |
| - | - |
| - | - |
| - | - |
| - | - |
| - | - |
| - | - |
| - | - |
| - | - |
| - | - |
| - | - |
| - | - |
| - | - |
| - | - |
| - | - |
| - | - |
| - | - |
| - | - |
| - | - |
| - | - |
| - | - |
| - | - |
| - | - |
| - | - |
| - | - |
| - | - |
| - | - |
| - | - |
| - | - |
| - | - |
| - | - |
The chart is not accessible to screen readers. Please switch to the table view to access the data.
Download
Source
Source
Release date
May 2025
More information
Region
Ireland
Survey time period
1990 to 2023
Supplementary notes
The source adds the following information about the index: "GII is a composite metric of gender inequality using three dimensions: reproductive health, empowerment and the labour market."
Citation formats