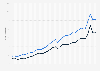
| Characteristic | Import value | Export value |
|---|---|---|
| 2010 | 8.85 | 8.85 |
| 2011 | 9.86 | 9.86 |
| 2012 | 9.94 | 9.94 |
| 2013 | 10.5 | 10.5 |
| 2014 | 10.8 | 10.8 |
| 2015 | 10 | 10 |
| 2016 | 10.3 | 10.3 |
| 2017 | 11.5 | 11.5 |
| 2018 | 12.3 | 12.3 |
| 2019 | 12.2 | 12.2 |
| 2020 | 11.9 | 11.9 |
| 2021 | 14.3 | 14.3 |
| 2022 | 14.6 | 14.6 |
| 2023 | 13.9 | 13.9 |
The chart is not accessible to screen readers. Please switch to the table view to access the data.
Loading statistic...
Download
Source
Sources
Release date
May 2025
More information
Region
Worldwide
Survey time period
2010 to 2023
Supplementary notes
The source does not specify the publication date. The release date given is the date of access.
In this dataset, the total global import and export values provided by the source are identical within the represented period. However, it is worth noting that global trade asymmetries may occur due to the presence of potential differences in measurement methods, data collection, reporting standards, currency exchange rates, trade barriers, and economic policies across countries.
Figures have been rounded.
Citation formats