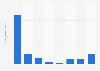
| Characteristic | Relative prices* for inpatient and outpatient services |
|---|---|
| - | - |
| - | - |
| - | - |
The chart is not accessible to screen readers. Please switch to the table view to access the data.
May 2024
United States
2018 to 2022
2022: over 4,000 Medicare-certified community hospitals in 49 states and DC except Maryland
The source adds the following:
*"Prices are calculated based on allowed amounts, including amounts paid by the health plan and the patient. Relative prices represent the allowed amount paid by the private plan as a percentage of what Medicare would have paid to the same hospital for the same services. Standardized prices represent the allowed amount paid by the private health plan per service, standardized using Medicare's case mix grouping and relative weights."
Claims data included "provider identifiers and allowed amounts, for enrollees in employer-sponsored health plans from three types of data sources: self-insured employers, state-based all-payer claims databases from Arkansas, Colorado, Connecticut, Delaware, Maine, Minnesota, New Hampshire, Oregon, Rhode Island, Utah, Vermont and Washington, and health plans that chose to participate. Together, those data sources include claims data for hospital services provided by more than 4,000 hospitals in 49 states and DC." See study for exact methodology.