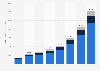
| Characteristic | Average daily spending in U.S. dollars |
|---|---|
| - | - |
| - | - |
| - | - |
| - | - |
| - | - |
| - | - |
| - | - |
The chart is not accessible to screen readers. Please switch to the table view to access the data.
Download
Source
Source
Release date
April 2024
More information
Region
Israel, MENA
Survey time period
January to September 2023
Number of respondents
17,646 respondents
Special properties
tourists who arrived by air and land crossings and stayed in Israel for at least one night
Method of interview
Questionnaire and personal interview
Supplementary notes
The expenses of tourists were reported in different currencies and for the whole group of travelers, and later converted to U.S. dollars per person.
Data is based on a sample of respondents at the main international border crossings.聽
This survey is a continuation of the tourism surveys in Israel conducted since 1993. The survey was not carried out in the last quarter of 2023.聽
Citation formats